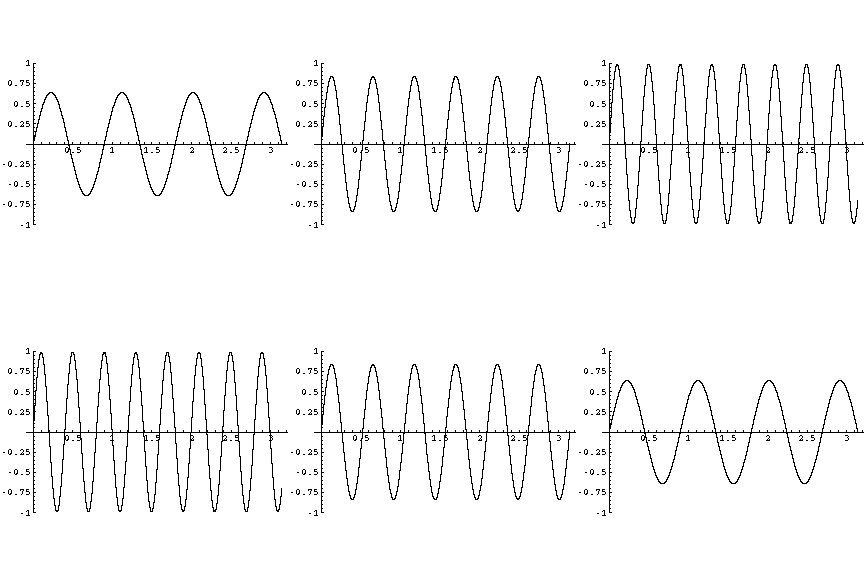

The individual figures contained in the animation above were created using the following Mathematica commands:
f[a_] := (25-a^2)/25*Sin[(16-a^2)*x]

Table[Plot[f[a], {x, 0, Pi}, PlotPoints->100, PlotRange->{-1,1}],
   {a, -3, 3, 1/2}]
Inside Mathematica, you can point and click to animate the result. To put the animation on the web, we saved the figures as GIF files and then combined them using the GIF Construction Set from Alchemy Mindworks.

[Home] [Cover] [Contents] [Description] [Sample Notebooks]
[Authors] [Publisher] [Availability] [Late News]